The First Domino to Fall: Retail-CRE (Commercial Real Estate)
The domino of retail CRE will not fall in isolation; it will topple the domino of debt next to it.
That the retail trade is stagnating has been well-established: for example, The Retail Death Rattle (The Burning Platform).
Equally well-established is the vulnerability of the bricks-n-mortar commercial real estate sector to this downturn: yesterday’s analysis by Mark G. makes the case:After Seven Lean Years, Part 2: US Commercial Real Estate: The Present Position and Future Prospects.
I’d like to extend Mark’s excellent analysis a bit because it suggests that the retail CRE (commercial real estate) sector will likely be the first domino to fall in the next financial crisis–the one we all know is brewing.
Let’s start with two charts of retail that I have marked up: the first is a chart of retail traffic from The Burning Platform story above. Note the phenomenal building boom in retail space from 2000 to 2008: nine straight years of adding about 300 million square feet of retail space each year.

The second chart shows department store sales, which fell by 15% during the retail building boom.
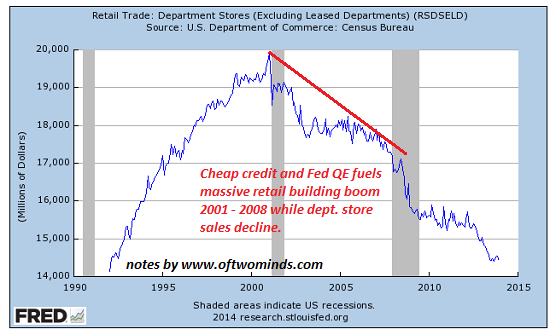
It might be possible to argue that this additional 2.7 billion square feet of retail space was needed as competitors ate the department store chains’ lunches, but let’s start by considering the foundation of retail sales: consumer income and credit.
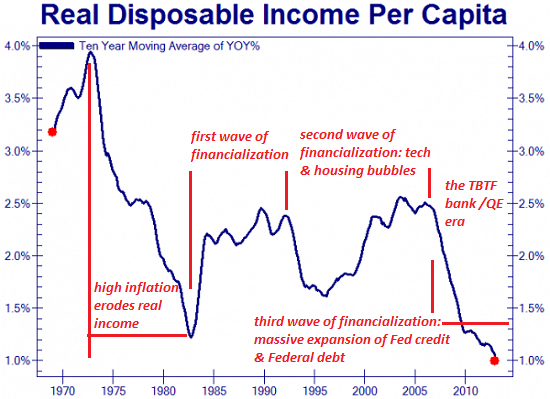
One way to measure income to adjust it for inflation (i.e. real income) and measure it per person (per capita) on a year-over-year (YoY) basis. Notice how real income per capita has absolutely cratered in the “too big to fail” quantitative easing (QE) era masterminded by the Federal Reserve: if this is success, I’d hate to see failure.
Another way to measure median household income:
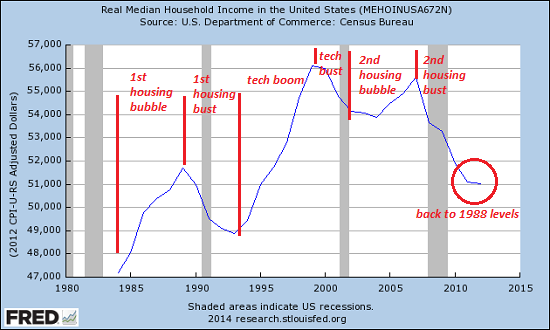
There’s a big problem with per capita (and mean or average) measures of income: a significant gain in the the top 10%’s income will mask the decline in the bottom 90%’s income. If households earning $150,000 annually get a boost to $200,000, that $50,000 increase not only offsets the decline of nine households who saw their income decline from $35,000 to $31,500 annually, but pushes both the per capita income metrics higher even as 9 of 10 households experienced a 10% decline in income.
The point here is that the declines are far deeper for the bottom 90% than shown on the per capita chart, as the top 10%’s increase in income has skewed per capita income higher. We can see this clearly in this chart:
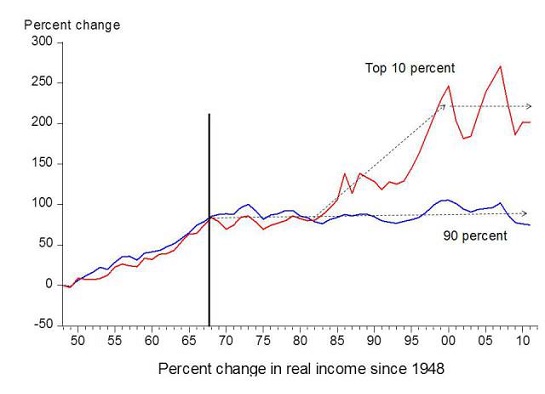
Notice how the income of the top 10% diverged from the bottom 90% once the era of financialization and asset bubbles started in the early 1980s. Each asset bubble–housing in the late 1980s, tech in the 1990s and housing again in the 2000s–nudged the incomes of the bottom 90% briefly into marginally positive territory while it spiked the incomes of the top 10% into the stratosphere.
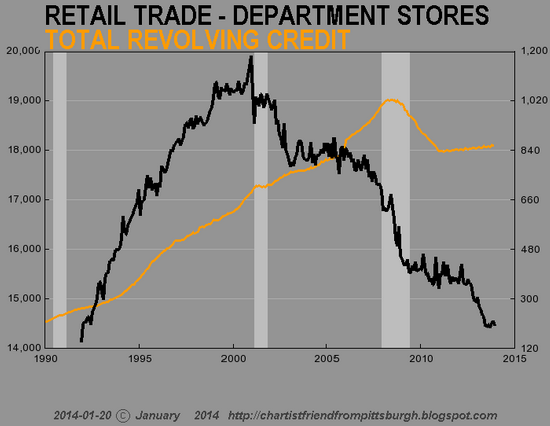
There are only two ways households can buy stuff: with income or credit/debt, as in charging purchases on credit cards. We’ve seen that income has tanked for the bottom 90%; how about credit/debt?
Courtesy of Chartist Friend from Pittsburgh, we can see that revolving consumer credit has flatlined:
There’s another component to the erosion of bricks-n-mortar and the ascent of eCommerce, as Chartist Friend from Pittsburgh explains:
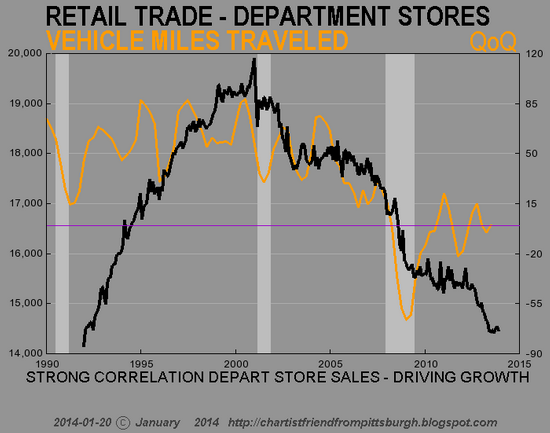
Fewer trips to the mall (correlated to maxed out credit cards, declining real disposable income and the ease of online shopping) also translates into fewer miles driven and fewer gallons of gasoline purchased:
All this boils down to one simple question: can the top 10% (roughly 11 million households) support the billions of square feet of retail space that were added in the 2000s? If the answer is no, as it clearly is, then the retail CRE sector is doomed to implode.
Let’s try a second simple question: what’s holding the retail CRE sector up?Answer: leases that will soon expire or be voided by insolvency, bankruptcy, etc. as retailers close stores and shutter their businesses.
One last question: who’s holding all the immense debt that’s piled on top of this soon-to-collapse sector? The domino of retail CRE will not fall in isolation; it will topple the domino of debt next to it, and that will topple the lenders who are bankrupted by the implosion of retail-CRE debt. And once that domino falls, it will take what’s left of the nation’s illusory financial stability down with it.
That the retail trade is stagnating has been well-established: for example, The Retail Death Rattle (The Burning Platform).
Equally well-established is the vulnerability of the bricks-n-mortar commercial real estate sector to this downturn: yesterday’s analysis by Mark G. makes the case:After Seven Lean Years, Part 2: US Commercial Real Estate: The Present Position and Future Prospects.
I’d like to extend Mark’s excellent analysis a bit because it suggests that the retail CRE (commercial real estate) sector will likely be the first domino to fall in the next financial crisis–the one we all know is brewing.
Let’s start with two charts of retail that I have marked up: the first is a chart of retail traffic from The Burning Platform story above. Note the phenomenal building boom in retail space from 2000 to 2008: nine straight years of adding about 300 million square feet of retail space each year.
The second chart shows department store sales, which fell by 15% during the retail building boom.
It might be possible to argue that this additional 2.7 billion square feet of retail space was needed as competitors ate the department store chains’ lunches, but let’s start by considering the foundation of retail sales: consumer income and credit.
One way to measure income to adjust it for inflation (i.e. real income) and measure it per person (per capita) on a year-over-year (YoY) basis. Notice how real income per capita has absolutely cratered in the “too big to fail” quantitative easing (QE) era masterminded by the Federal Reserve: if this is success, I’d hate to see failure.
Another way to measure median household income:
There’s a big problem with per capita (and mean or average) measures of income: a significant gain in the the top 10%’s income will mask the decline in the bottom 90%’s income. If households earning $150,000 annually get a boost to $200,000, that $50,000 increase not only offsets the decline of nine households who saw their income decline from $35,000 to $31,500 annually, but pushes both the per capita income metrics higher even as 9 of 10 households experienced a 10% decline in income.
The point here is that the declines are far deeper for the bottom 90% than shown on the per capita chart, as the top 10%’s increase in income has skewed per capita income higher. We can see this clearly in this chart:
Notice how the income of the top 10% diverged from the bottom 90% once the era of financialization and asset bubbles started in the early 1980s. Each asset bubble–housing in the late 1980s, tech in the 1990s and housing again in the 2000s–nudged the incomes of the bottom 90% briefly into marginally positive territory while it spiked the incomes of the top 10% into the stratosphere.
There are only two ways households can buy stuff: with income or credit/debt, as in charging purchases on credit cards. We’ve seen that income has tanked for the bottom 90%; how about credit/debt?
Courtesy of Chartist Friend from Pittsburgh, we can see that revolving consumer credit has flatlined:
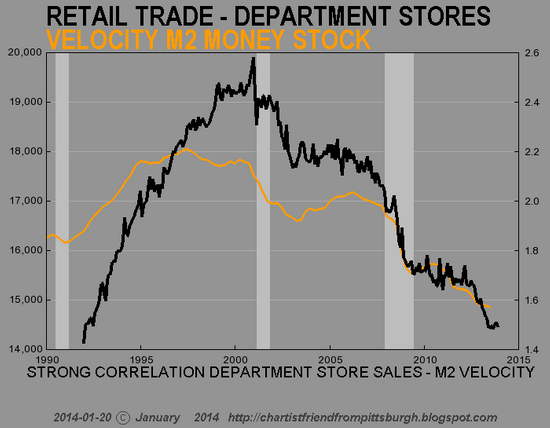
There’s another component to the erosion of bricks-n-mortar and the ascent of eCommerce, as Chartist Friend from Pittsburgh explains:
This M2 (money) velocity chart is better because it reminds us of the days when you would drive to the mall to make a purchase, and while you were there you’d stop at the food court to have lunch, and then maybe you’d walk around afterwards and see some other item you wanted to buy, or run into friends and decide to catch a movie or have a drink, etc. At the mall there are lots of ways for money to change hands – online not so much.
Fewer trips to the mall (correlated to maxed out credit cards, declining real disposable income and the ease of online shopping) also translates into fewer miles driven and fewer gallons of gasoline purchased:
All this boils down to one simple question: can the top 10% (roughly 11 million households) support the billions of square feet of retail space that were added in the 2000s? If the answer is no, as it clearly is, then the retail CRE sector is doomed to implode.
Let’s try a second simple question: what’s holding the retail CRE sector up?Answer: leases that will soon expire or be voided by insolvency, bankruptcy, etc. as retailers close stores and shutter their businesses.
One last question: who’s holding all the immense debt that’s piled on top of this soon-to-collapse sector? The domino of retail CRE will not fall in isolation; it will topple the domino of debt next to it, and that will topple the lenders who are bankrupted by the implosion of retail-CRE debt. And once that domino falls, it will take what’s left of the nation’s illusory financial stability down with it.
Read more at http://www.maxkeiser.com/2014/01/the-first-domino-to-fall-retail-cre-commercial-real-estate/#CrqHUwoGCJgkkM7G.99
The First Domino to Fall: Retail-CRE (Commercial Real Estate)
The domino of retail CRE will not fall in isolation; it will topple the domino of debt next to it.
That the retail trade is stagnating has been well-established: for example, The Retail Death Rattle (The Burning Platform).
Equally well-established is the vulnerability of the bricks-n-mortar commercial real estate sector to this downturn: yesterday’s analysis by Mark G. makes the case:After Seven Lean Years, Part 2: US Commercial Real Estate: The Present Position and Future Prospects.
I’d like to extend Mark’s excellent analysis a bit because it suggests that the retail CRE (commercial real estate) sector will likely be the first domino to fall in the next financial crisis–the one we all know is brewing.
Let’s start with two charts of retail that I have marked up: the first is a chart of retail traffic from The Burning Platform story above. Note the phenomenal building boom in retail space from 2000 to 2008: nine straight years of adding about 300 million square feet of retail space each year.
The second chart shows department store sales, which fell by 15% during the retail building boom.
It might be possible to argue that this additional 2.7 billion square feet of retail space was needed as competitors ate the department store chains’ lunches, but let’s start by considering the foundation of retail sales: consumer income and credit.
One way to measure income to adjust it for inflation (i.e. real income) and measure it per person (per capita) on a year-over-year (YoY) basis. Notice how real income per capita has absolutely cratered in the “too big to fail” quantitative easing (QE) era masterminded by the Federal Reserve: if this is success, I’d hate to see failure.
Another way to measure median household income:
There’s a big problem with per capita (and mean or average) measures of income: a significant gain in the the top 10%’s income will mask the decline in the bottom 90%’s income. If households earning $150,000 annually get a boost to $200,000, that $50,000 increase not only offsets the decline of nine households who saw their income decline from $35,000 to $31,500 annually, but pushes both the per capita income metrics higher even as 9 of 10 households experienced a 10% decline in income.
The point here is that the declines are far deeper for the bottom 90% than shown on the per capita chart, as the top 10%’s increase in income has skewed per capita income higher. We can see this clearly in this chart:
Notice how the income of the top 10% diverged from the bottom 90% once the era of financialization and asset bubbles started in the early 1980s. Each asset bubble–housing in the late 1980s, tech in the 1990s and housing again in the 2000s–nudged the incomes of the bottom 90% briefly into marginally positive territory while it spiked the incomes of the top 10% into the stratosphere.
There are only two ways households can buy stuff: with income or credit/debt, as in charging purchases on credit cards. We’ve seen that income has tanked for the bottom 90%; how about credit/debt?
Courtesy of Chartist Friend from Pittsburgh, we can see that revolving consumer credit has flatlined:
There’s another component to the erosion of bricks-n-mortar and the ascent of eCommerce, as Chartist Friend from Pittsburgh explains:
Fewer trips to the mall (correlated to maxed out credit cards, declining real disposable income and the ease of online shopping) also translates into fewer miles driven and fewer gallons of gasoline purchased:
All this boils down to one simple question: can the top 10% (roughly 11 million households) support the billions of square feet of retail space that were added in the 2000s? If the answer is no, as it clearly is, then the retail CRE sector is doomed to implode.
Let’s try a second simple question: what’s holding the retail CRE sector up?Answer: leases that will soon expire or be voided by insolvency, bankruptcy, etc. as retailers close stores and shutter their businesses.
One last question: who’s holding all the immense debt that’s piled on top of this soon-to-collapse sector? The domino of retail CRE will not fall in isolation; it will topple the domino of debt next to it, and that will topple the lenders who are bankrupted by the implosion of retail-CRE debt. And once that domino falls, it will take what’s left of the nation’s illusory financial stability down with it.
That the retail trade is stagnating has been well-established: for example, The Retail Death Rattle (The Burning Platform).
Equally well-established is the vulnerability of the bricks-n-mortar commercial real estate sector to this downturn: yesterday’s analysis by Mark G. makes the case:After Seven Lean Years, Part 2: US Commercial Real Estate: The Present Position and Future Prospects.
I’d like to extend Mark’s excellent analysis a bit because it suggests that the retail CRE (commercial real estate) sector will likely be the first domino to fall in the next financial crisis–the one we all know is brewing.
Let’s start with two charts of retail that I have marked up: the first is a chart of retail traffic from The Burning Platform story above. Note the phenomenal building boom in retail space from 2000 to 2008: nine straight years of adding about 300 million square feet of retail space each year.
The second chart shows department store sales, which fell by 15% during the retail building boom.
It might be possible to argue that this additional 2.7 billion square feet of retail space was needed as competitors ate the department store chains’ lunches, but let’s start by considering the foundation of retail sales: consumer income and credit.
One way to measure income to adjust it for inflation (i.e. real income) and measure it per person (per capita) on a year-over-year (YoY) basis. Notice how real income per capita has absolutely cratered in the “too big to fail” quantitative easing (QE) era masterminded by the Federal Reserve: if this is success, I’d hate to see failure.
Another way to measure median household income:
There’s a big problem with per capita (and mean or average) measures of income: a significant gain in the the top 10%’s income will mask the decline in the bottom 90%’s income. If households earning $150,000 annually get a boost to $200,000, that $50,000 increase not only offsets the decline of nine households who saw their income decline from $35,000 to $31,500 annually, but pushes both the per capita income metrics higher even as 9 of 10 households experienced a 10% decline in income.
The point here is that the declines are far deeper for the bottom 90% than shown on the per capita chart, as the top 10%’s increase in income has skewed per capita income higher. We can see this clearly in this chart:
Notice how the income of the top 10% diverged from the bottom 90% once the era of financialization and asset bubbles started in the early 1980s. Each asset bubble–housing in the late 1980s, tech in the 1990s and housing again in the 2000s–nudged the incomes of the bottom 90% briefly into marginally positive territory while it spiked the incomes of the top 10% into the stratosphere.
There are only two ways households can buy stuff: with income or credit/debt, as in charging purchases on credit cards. We’ve seen that income has tanked for the bottom 90%; how about credit/debt?
Courtesy of Chartist Friend from Pittsburgh, we can see that revolving consumer credit has flatlined:
There’s another component to the erosion of bricks-n-mortar and the ascent of eCommerce, as Chartist Friend from Pittsburgh explains:
This M2 (money) velocity chart is better because it reminds us of the days when you would drive to the mall to make a purchase, and while you were there you’d stop at the food court to have lunch, and then maybe you’d walk around afterwards and see some other item you wanted to buy, or run into friends and decide to catch a movie or have a drink, etc. At the mall there are lots of ways for money to change hands – online not so much.
Fewer trips to the mall (correlated to maxed out credit cards, declining real disposable income and the ease of online shopping) also translates into fewer miles driven and fewer gallons of gasoline purchased:
All this boils down to one simple question: can the top 10% (roughly 11 million households) support the billions of square feet of retail space that were added in the 2000s? If the answer is no, as it clearly is, then the retail CRE sector is doomed to implode.
Let’s try a second simple question: what’s holding the retail CRE sector up?Answer: leases that will soon expire or be voided by insolvency, bankruptcy, etc. as retailers close stores and shutter their businesses.
One last question: who’s holding all the immense debt that’s piled on top of this soon-to-collapse sector? The domino of retail CRE will not fall in isolation; it will topple the domino of debt next to it, and that will topple the lenders who are bankrupted by the implosion of retail-CRE debt. And once that domino falls, it will take what’s left of the nation’s illusory financial stability down with it.
Read more at http://www.maxkeiser.com/2014/01/the-first-domino-to-fall-retail-cre-commercial-real-estate/#CrqHUwoGCJgkkM7G.99
No comments:
Post a Comment